MFCommander Infra
A Kubernetes GUI that is also a damn fine file manager.
Browse your cluster, read the YAML, follow the logs, and run the actions, in the same window where you move files. Browse and copy files in a volume like a folder. It does Docker too.
14 days, all features, no card. Uses the kubectl and kubeconfig you already have.
Everything your cluster serves, including your custom resources.
The built-in kinds are grouped the way you think about them. Whatever else your cluster serves is discovered through kubectl api-resources and listed under its own API group.
Cluster
Overview, Events, Nodes, Namespaces.
Workloads
Pods, Deployments, StatefulSets, DaemonSets, ReplicaSets, Jobs, CronJobs.
Config
Config Maps, Secrets, Resource Quotas, Limit Ranges, PDBs, HPAs, VPAs, Priority Classes.
Network
Services, Endpoints, Endpoint Slices, Gateways, Gateway Classes, HTTP Routes, Network Policies.
Storage
Persistent Volumes, Persistent Volume Claims, Storage Classes.
Helm
Releases, collapsed to one row each from the Helm 3 revision secrets.
Access Control
Service Accounts, Roles, Cluster Roles, and both kinds of binding.
Custom Resources
The definitions, plus every discovered instance kind nested under its API group.
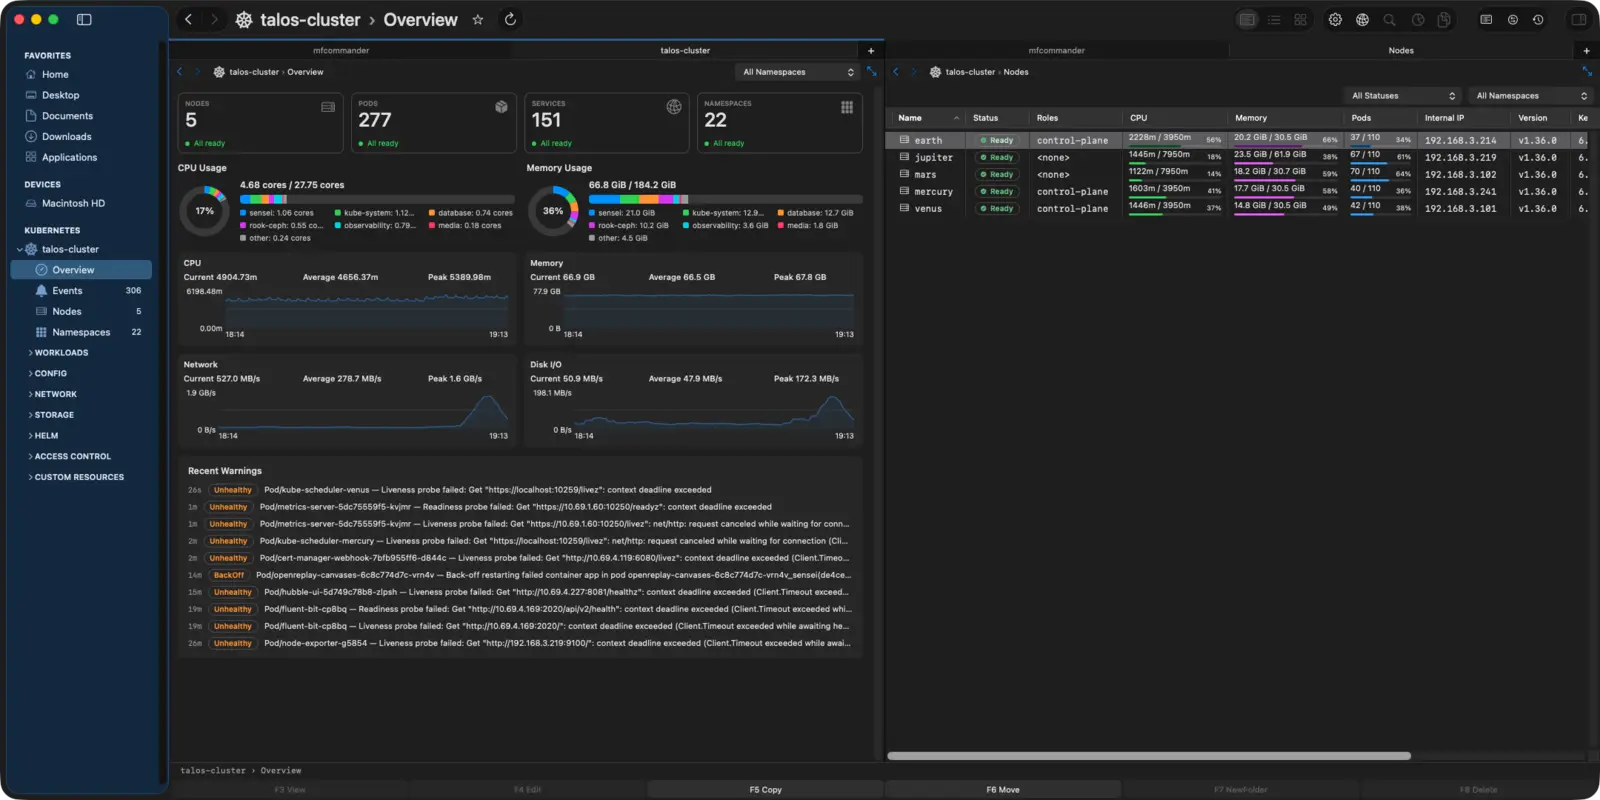
The detail view answers the next question, not just the current one.
Selecting a resource lays out what you came to find instead of making you read a wall of describe output. Summary chips, conditions, recent events, labels, and every container with its current CPU and memory, on one screen. Workloads add Monitoring and Logs tabs. Everything else is Overview and YAML.
Related Resources answers the question after that one. Whatever owns this resource, manages it, selects it, or uses it is listed beside it, each entry a link that loads it in place, so nobody has to work out what a Deployment's ReplicaSet was called and then go hunting for it. Each group is bounded at fifty, with a link to the full list past that.
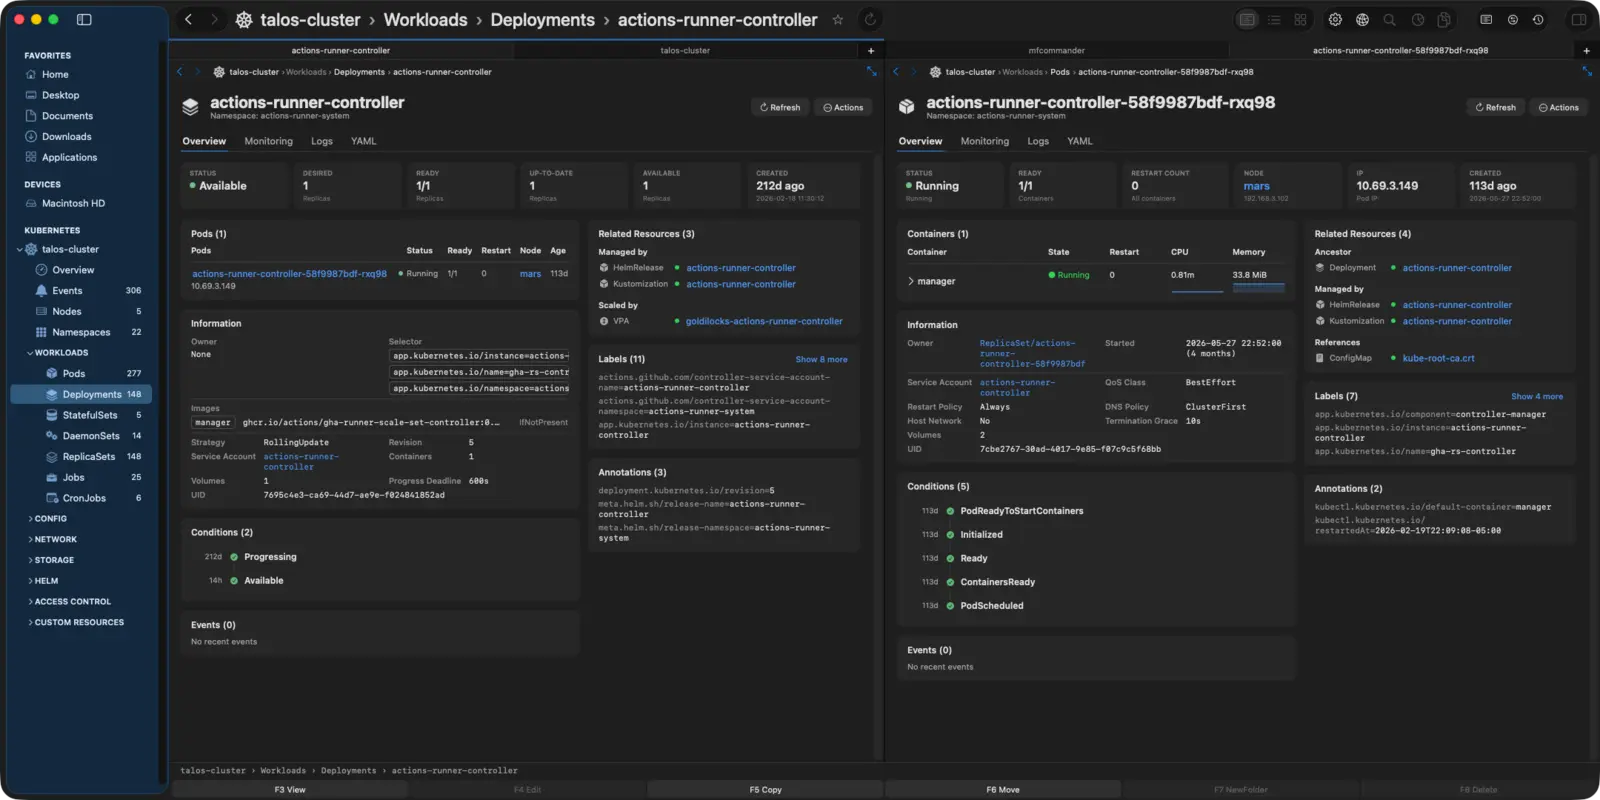
Logs from the Logs tab
Follow one pod's output, or select several and read them as a single merged stream, in the same viewer that opens a gigabyte file without loading it.
YAML you can edit
Read-only until you choose Edit, checked with a dry run before it applies, and refused while read-only mode is on. F3 opens it in the large-file viewer instead.
Monitoring
CPU, memory, network, and disk charts from Prometheus, found in your cluster automatically or pointed wherever you tell the connection to look. Metrics Server is the fallback.
Actions that know the kind
Scale a Deployment, restart a StatefulSet, evict a pod with its disruption budget respected, cordon or drain a node, suspend a CronJob. Nothing offered where it makes no sense.
Metrics in the lists
Pod and node lists carry live CPU and memory columns, with the last reading carried forward so a momentary gap does not blank the table.
Secrets, revealed deliberately
A Secret's keys are listed but not shown until you ask for one, so a glance over your shoulder does not become an incident.
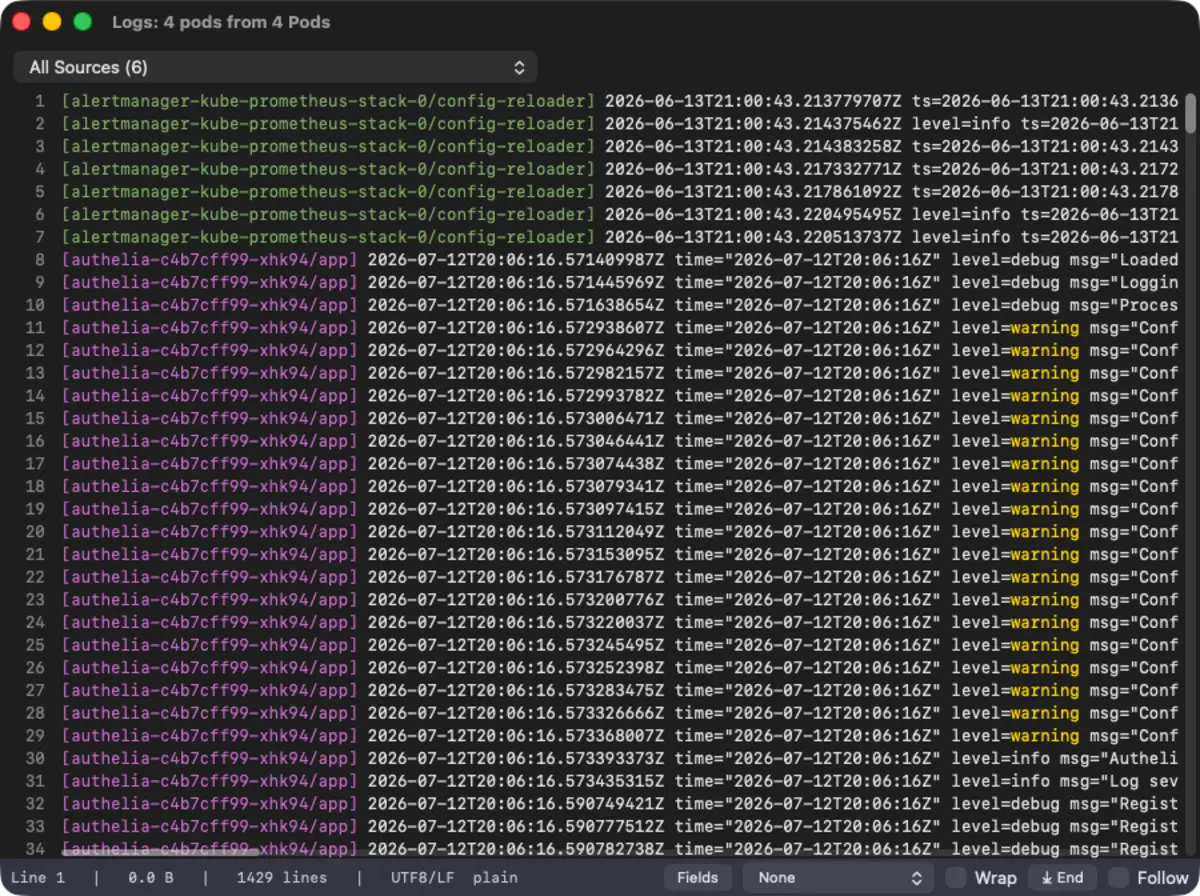
View logs across multiple pods in a single window.
Select several pods and their output merges into one stream with a source filter, instead of a window for each, and Follow pins it to the end as it grows. A chatty pod at three in the morning produces more log than a text area wants to hold, which is why most tools truncate or slow to a crawl. Cluster logs go to the same viewer as files, so the stream spools to disk, only the viewport is read, and memory does not grow with how long you leave it running. How the viewer works, and the measurements behind it.
Browse a persistent volume like a folder.
Select a PVC and choose Browse Files, or double-click it. Its contents list the way any other folder does, and F5 copies in either direction between the volume and the other pane, whether that is a folder on your Mac, an S3 bucket, or an SFTP server.
It goes through a pod you are already running that mounts the volume, and creates a short-lived helper only when there is none. Exactly what that pod is, and how it goes away.
Docker works the same.
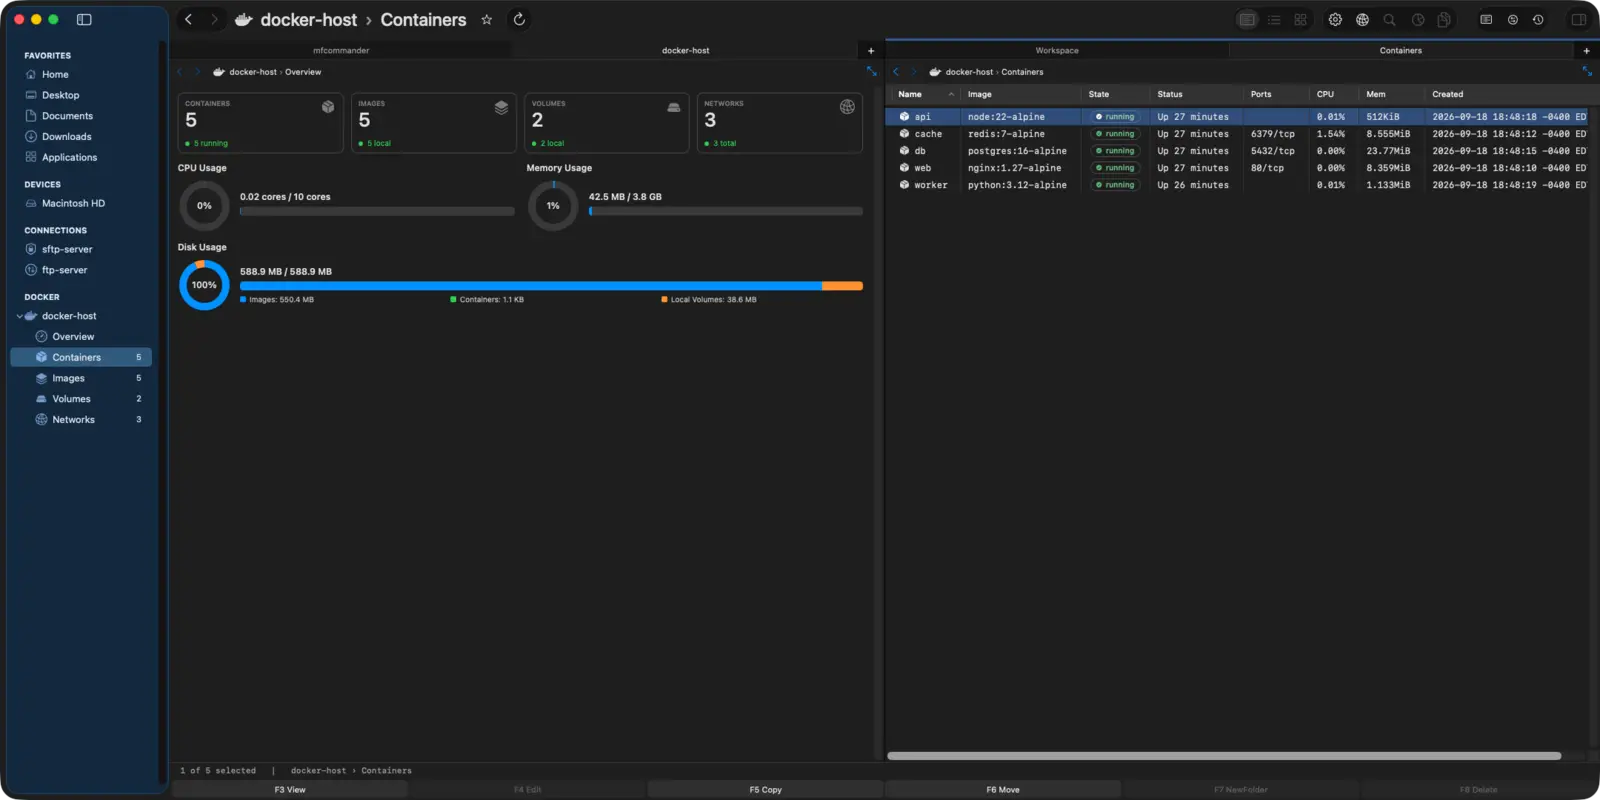
Containers, Images, Volumes, and Networks, with an overview carrying counts, live CPU and memory, and where the disk went. Start, stop, restart, pause, kill, and remove containers. Pull and remove images. Follow container logs in the same viewer.
Volumes browse exactly like PVCs do. It drives the docker command you already have, with your current context, so whatever your CLI can reach, this can reach.
Read-only until you say otherwise.
Both browsers start read-only. Scaling, restarting, deleting, applying YAML, and writing to a volume are refused until you turn the guard off. Authorization is your kubeconfig's and nothing else: every action runs as you, so a read-only service account produces a read-only application.
The long version, written for whoever has to approve it, covers what runs in the cluster, where credentials live, and everything the application sends anywhere.
Point it at a cluster for fourteen days.
Every feature, no card, and read-only is already on. Infra is a one-time $99.99 and includes everything in Pro, so the same window also reaches your SMB shares, SFTP servers, and S3 buckets.